Week 4: Netflix Ratings Analysis
Day 1
Overview
This week, we explored patterns in Netflix’s rating data using visualizations and began building a recommender system using a neural network. Below are the highlights and insights from Day 1.
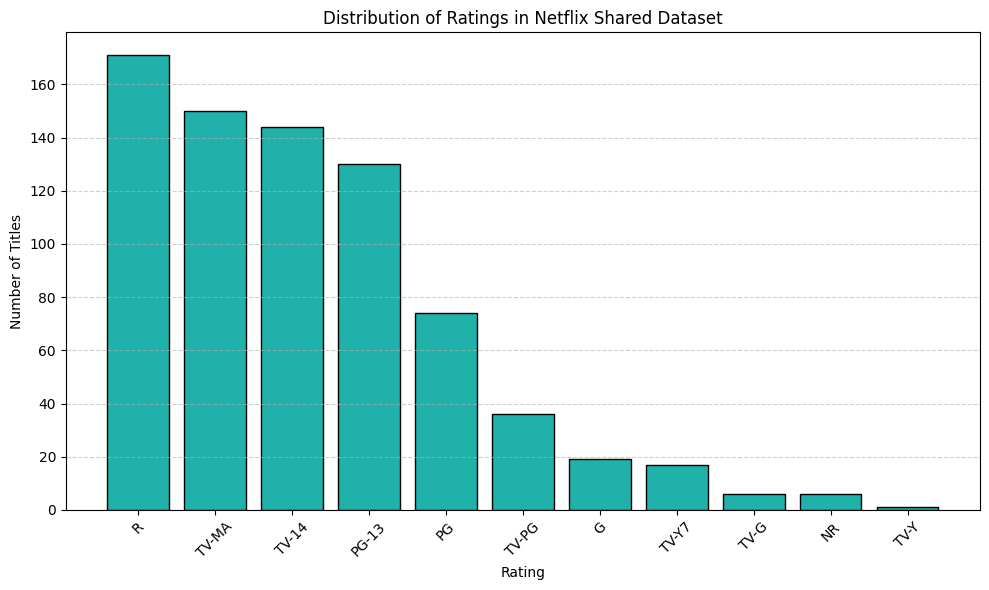
📊 Distribution of Titles by Content Rating
This chart shows the number of titles available on Netflix by their content rating (e.g., PG, PG-13, R). It highlights that Rated R titles dominate the platform, while TV-Y titles (intended for very young audiences) are relatively rare.
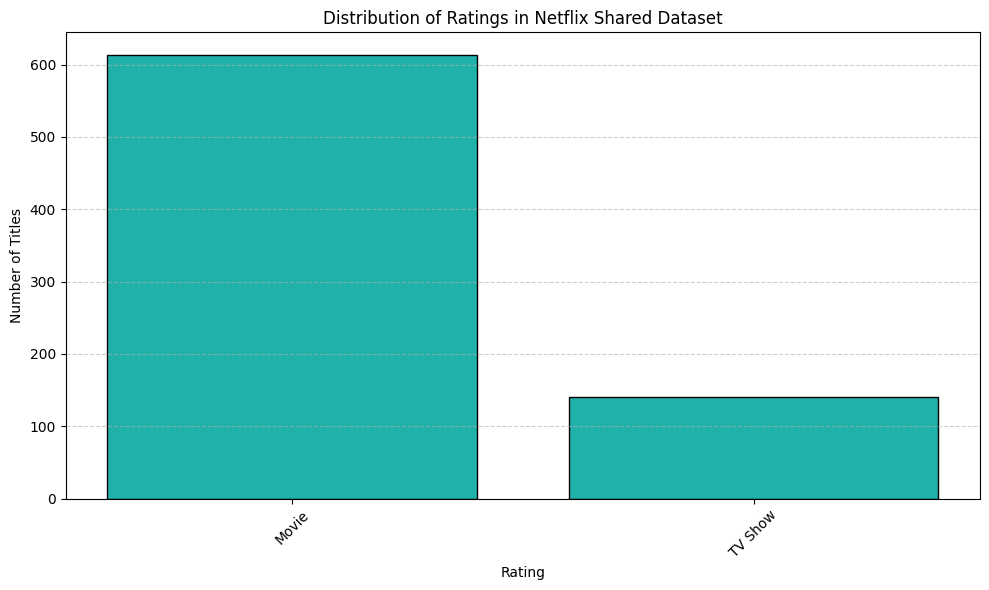
📺 Movies vs TV Shows by Rating
This visualization compares the count of movies and TV shows on Netflix. We found that movies significantly outnumber TV shows.
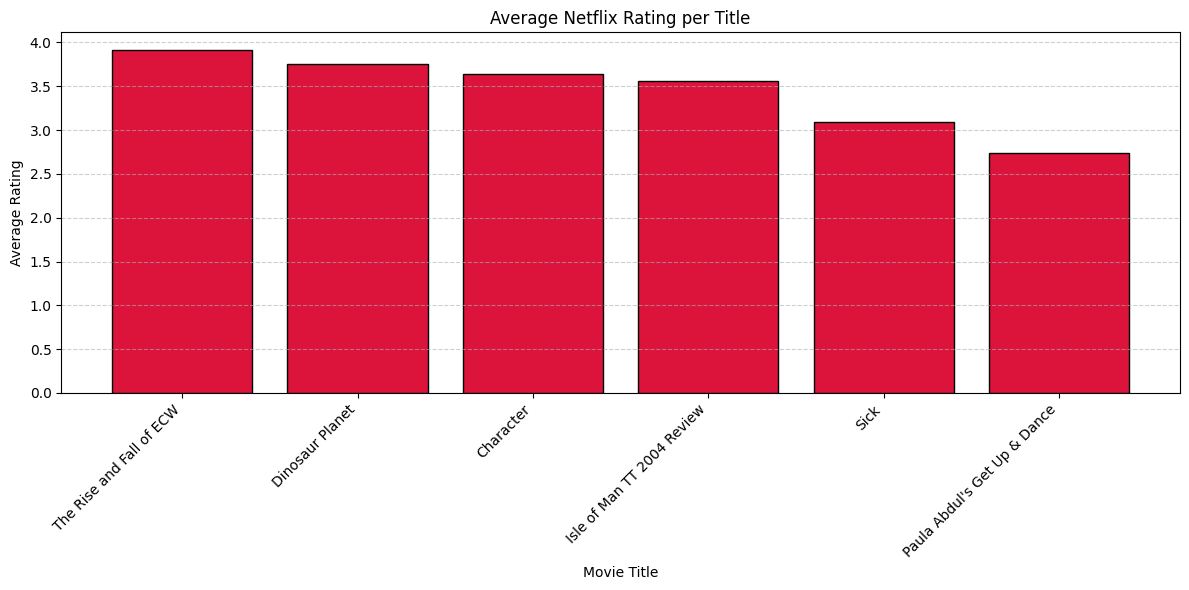
⭐ Average Ratings of Netflix Titles
This chart illustrates the average user ratings across different Netflix titles. It helps reveal which titles resonated most with viewers.
Day 2
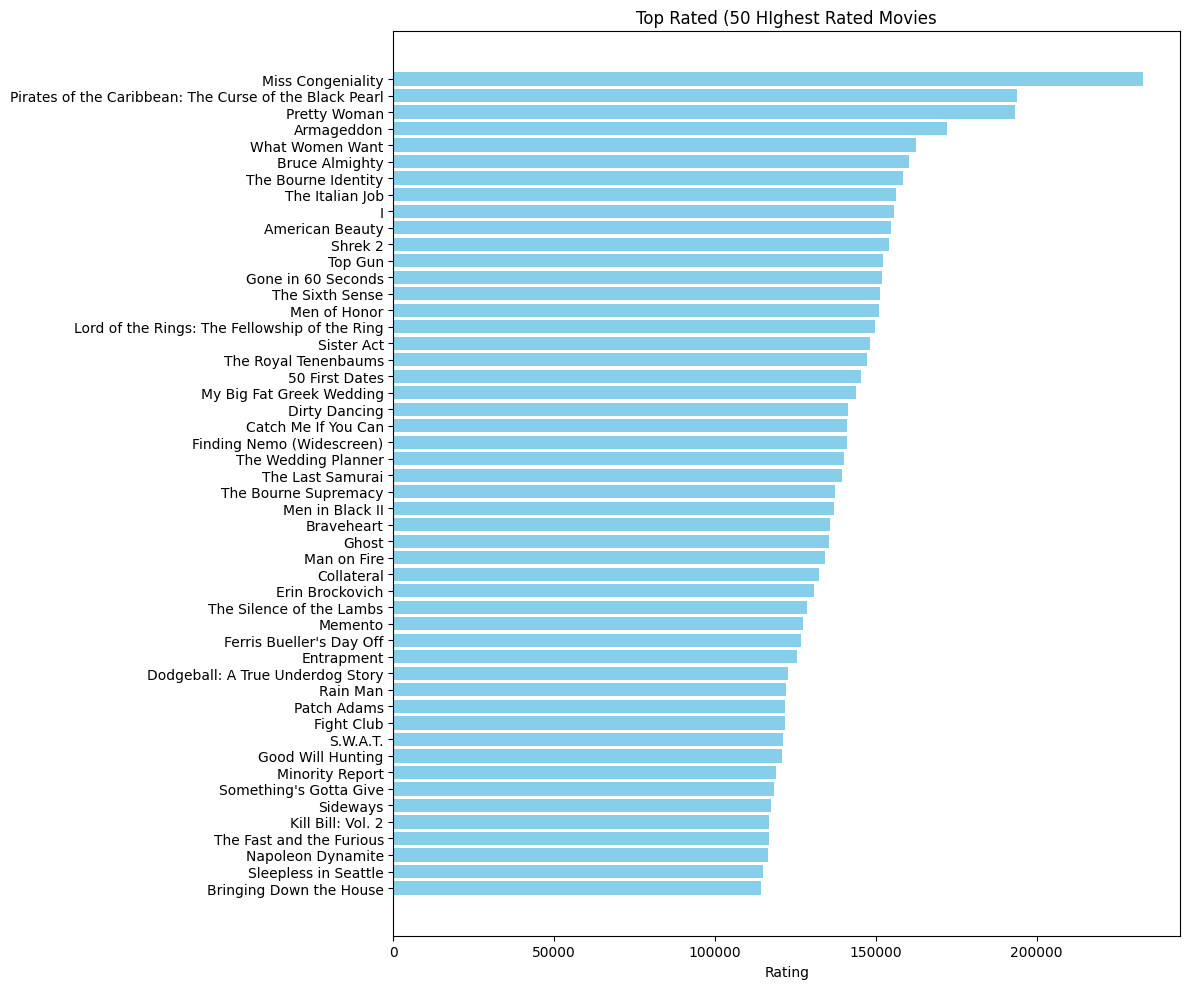
🏆 Top 50 Highest Rated Movies
The graph below shows the top 50 highest-rated movies on Netflix. Miss Congeniality tops the list with over 200,000 total user rating points. The 50th-ranked film, Bringing Down the House, still received an impressive ~120,000 total points. Each title’s score reflects the total sum of user ratings.
🧠 Building a Neural Network Recommender System
We created a neural network that predicts whether a user would enjoy a movie based on two inputs:
- User ID (Input A)
- Movie ID (Input B)
The model learns from how each user rated previous movies and how each movie was rated by others. Based on that, it generates a prediction for how a user would rate a new movie.
🧮 Model Architecture Summary
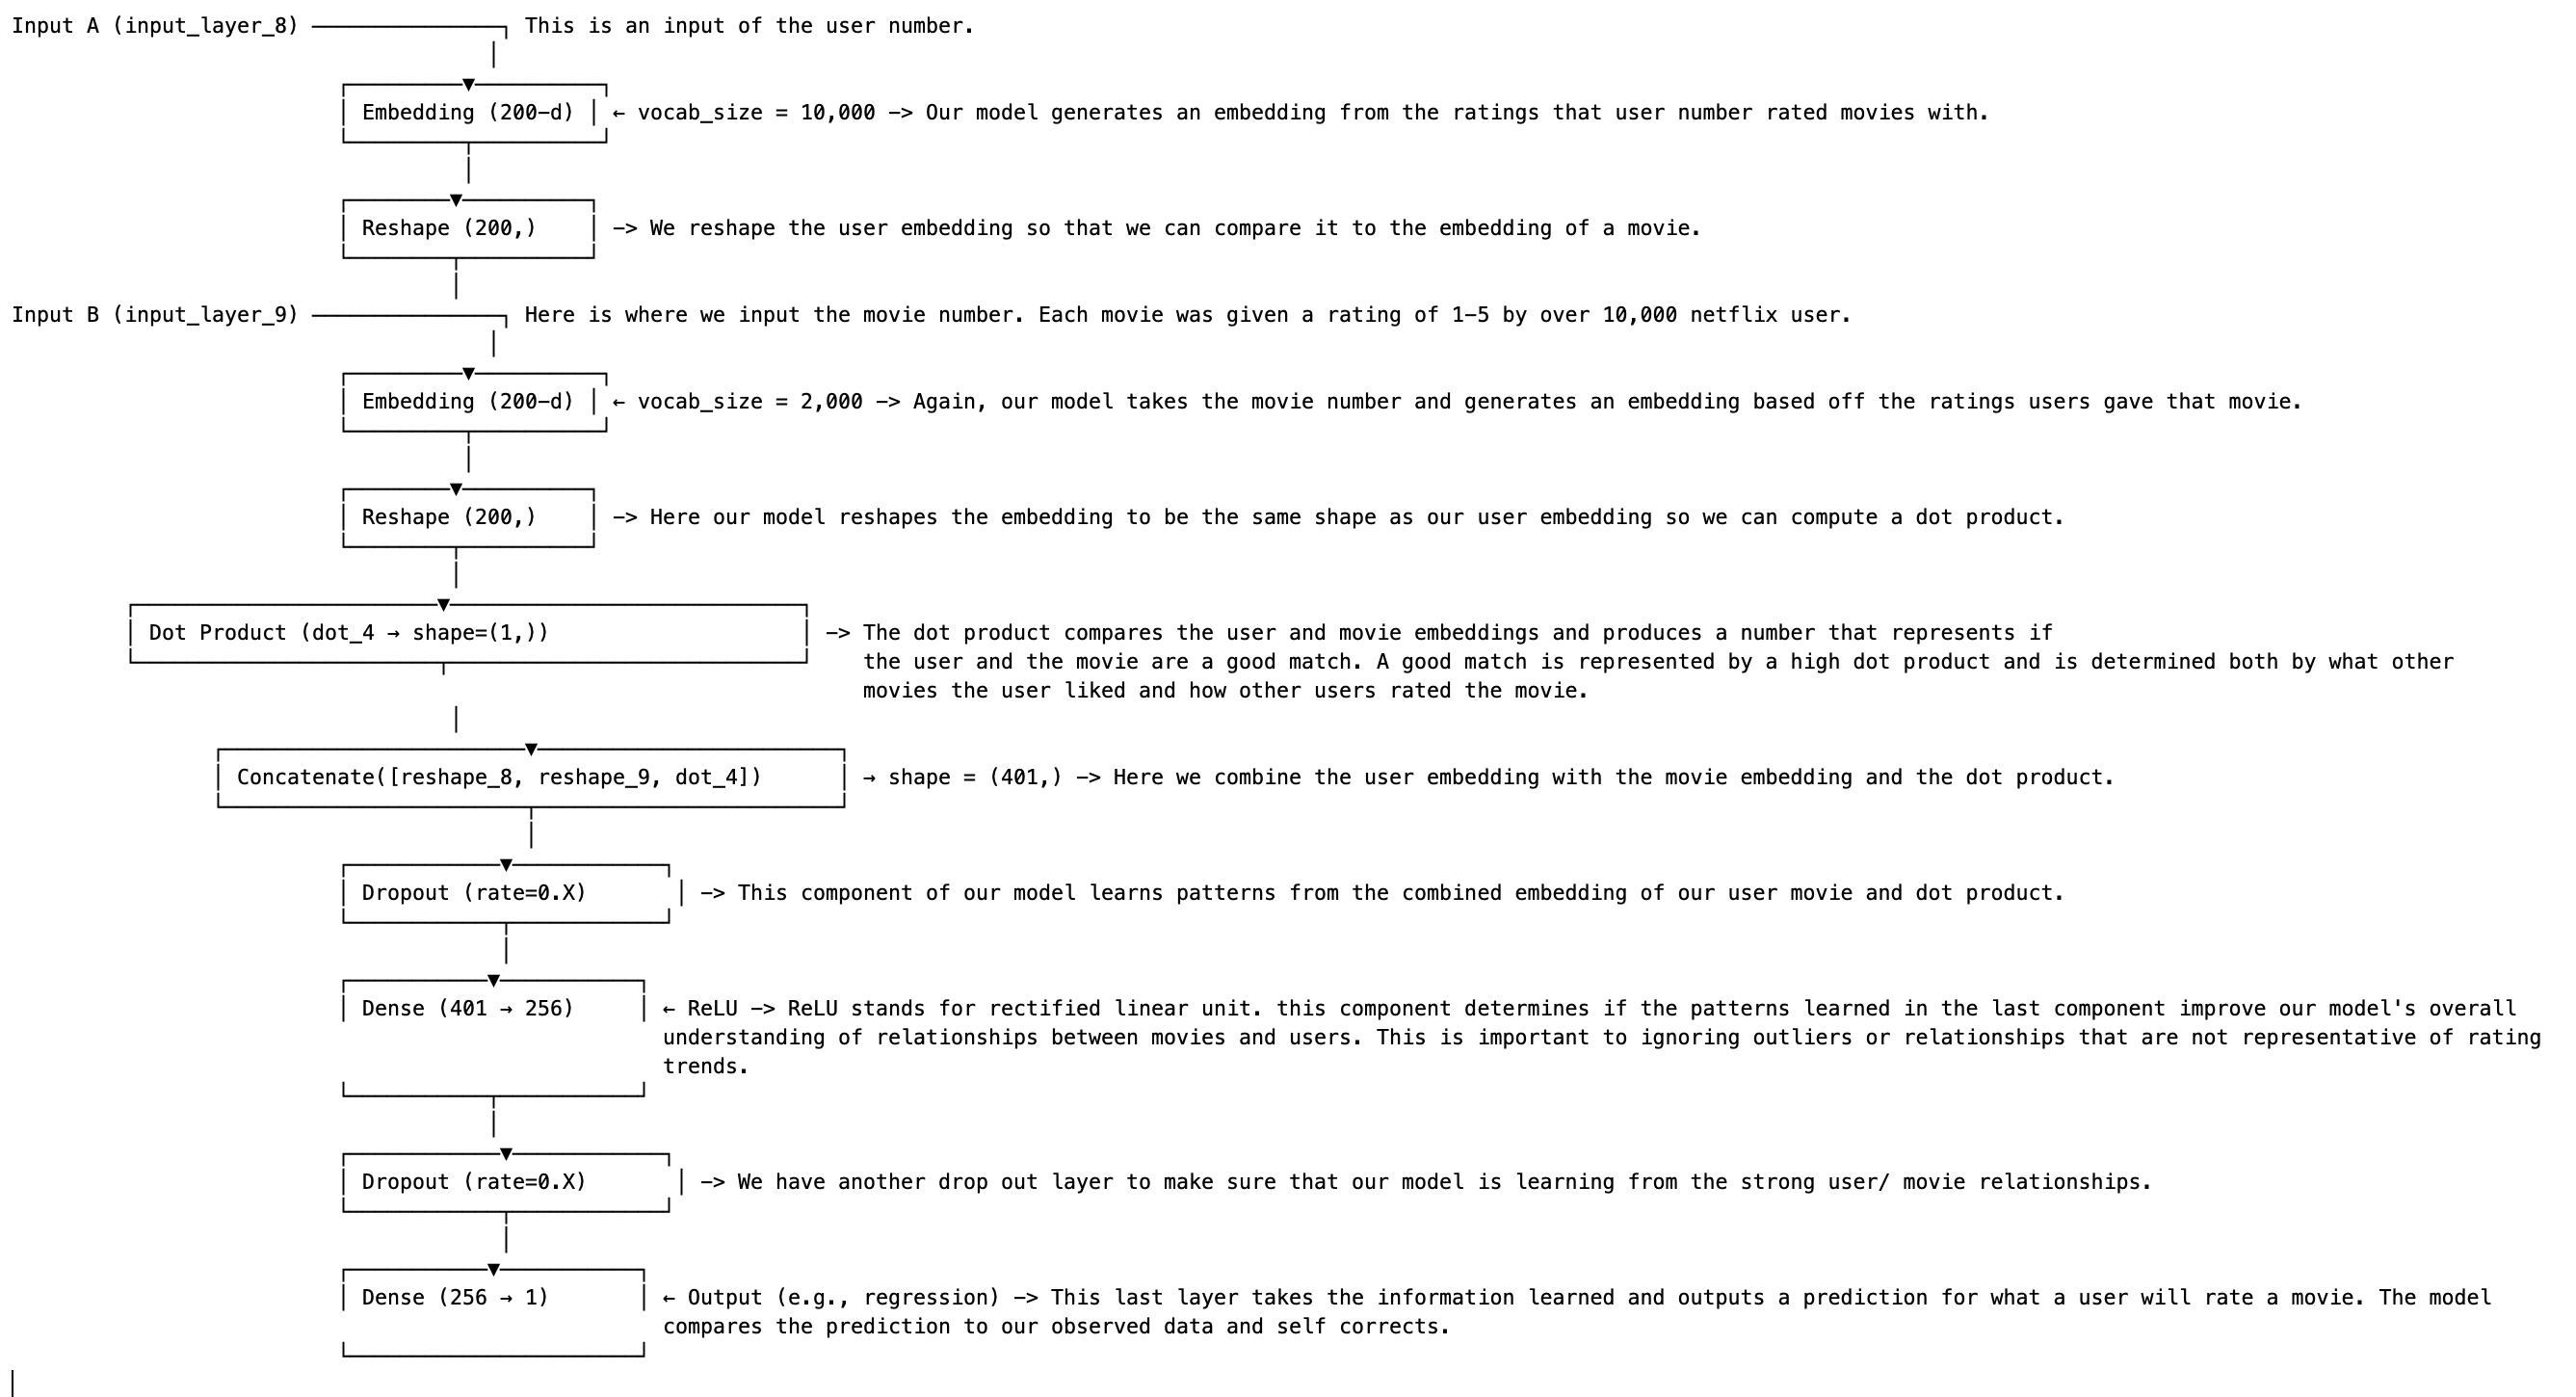
This visual summarizes the architecture of our neural network recommender system. The model takes in two inputs—user ID and movie ID—and passes them through embedding layers. These embeddings are compared using a dot product and concatenated before passing through multiple dense layers. The final output is a predicted rating score, representing how much the model thinks the user would enjoy the movie.
Day 3
📉 Model Training Evaluation
Today, we evaluated the performance of our neural network model after training it for 5 epochs.
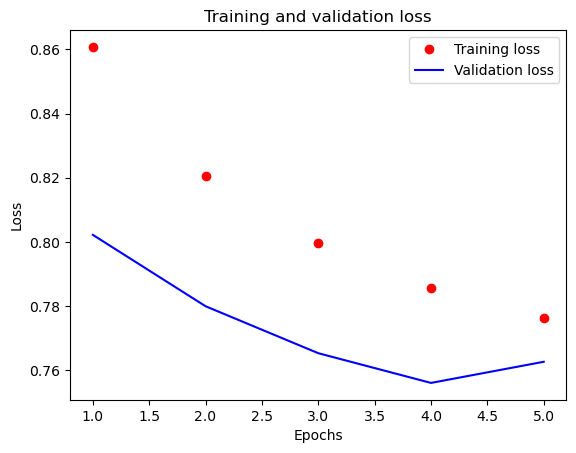
The plot above shows the training and validation loss over each epoch:
- ✅ Training loss steadily declined across all 5 epochs.
- ⭐ Validation loss reached its lowest point at epoch 4.
- ⚠️ A slight increase in validation loss during epoch 5 suggests potential overfitting.
We interpret this as the model performing best at epoch 4, with diminishing returns (and slight overtraining) thereafter.
Final Performance:
🧪 The model achieved 82% accuracy on a held-out test set of ~20,000 samples, showing strong generalization on unseen data.
🎯 Predicted Genre Preferences – User 808
The graph below shows the median predicted rating for user 808, broken down by genre. We used our trained model to infer which genres this user would most likely enjoy.
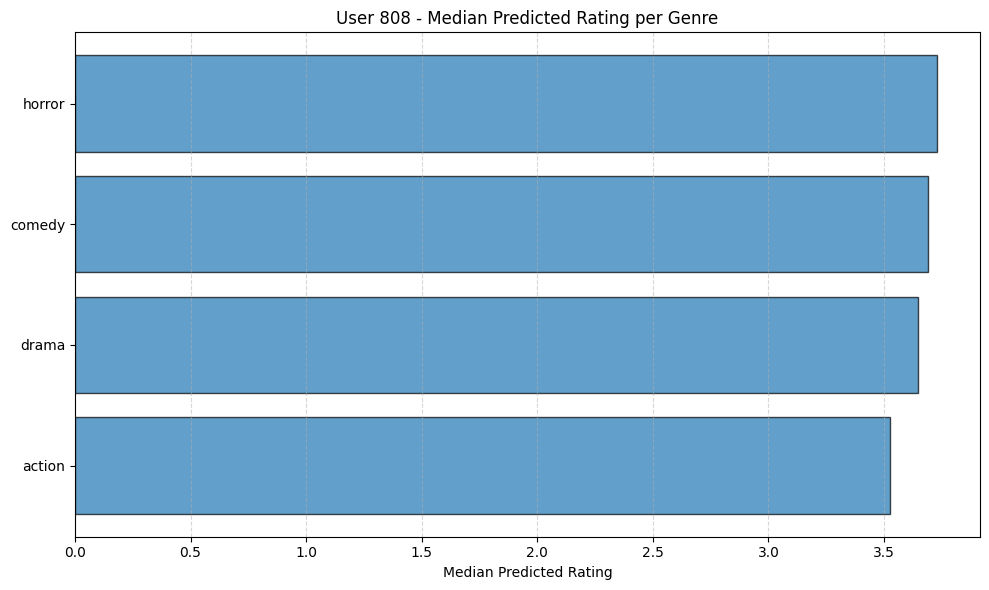
Based on the results:
- 🧟♀️ Horror was the highest-rated genre, suggesting this user has a strong preference for scary or suspenseful content.
- 🎬 Action received the lowest median rating, indicating it may not align with the user’s viewing preferences.
This approach highlights how we can personalize recommendations by analyzing predicted ratings across genre categories—offering a more targeted and meaningful viewing experience.