Day 1
📊 Week 2: Field Goals vs. Points Scored
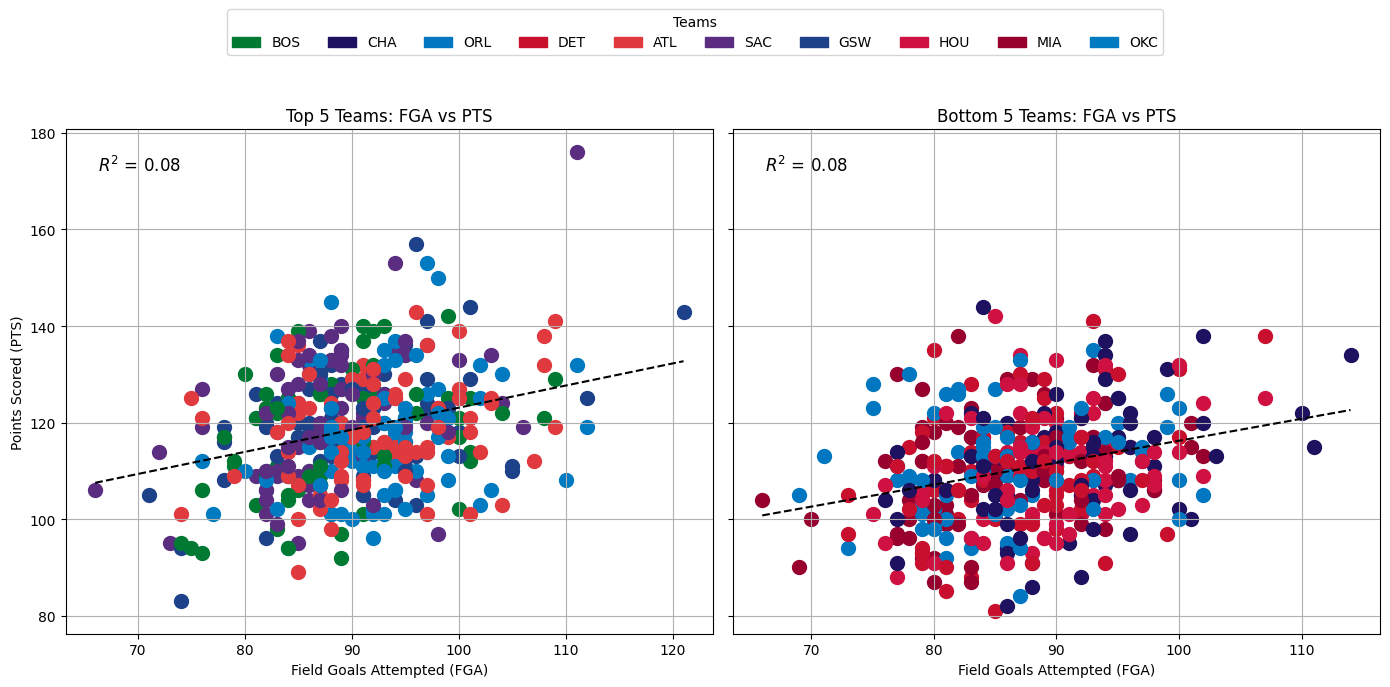
In this week’s analysis, we explored the relationship between Field Goals Attempted (FGA) and points scored using data from the top 5 and bottom 5 scoring teams in the 2022–23 NBA season.
🔝 Top 5 vs. Bottom 5 Scoring Teams
- Top 5 scoring teams averaged 90 FG attempts per game, compared to 87 attempts for the bottom 5.
- Top 5 teams scored around 118 PPG, while the bottom 5 averaged 110 PPG.
- Top 5 teams scored 140+ points in 15 games, compared to just 3 games for the bottom 5.
- In those 140+ point games, top 5 teams took 99 shots on average, while the bottom 5 took 87.
- The bottom 5 scored under 100 points in 76 games, while the top 5 only did so in 20 games.
- In sub-100 point games, teams attempted just 84 shots on average.
🔬 Sacramento vs. Miami: High vs. Low Scoring Teams
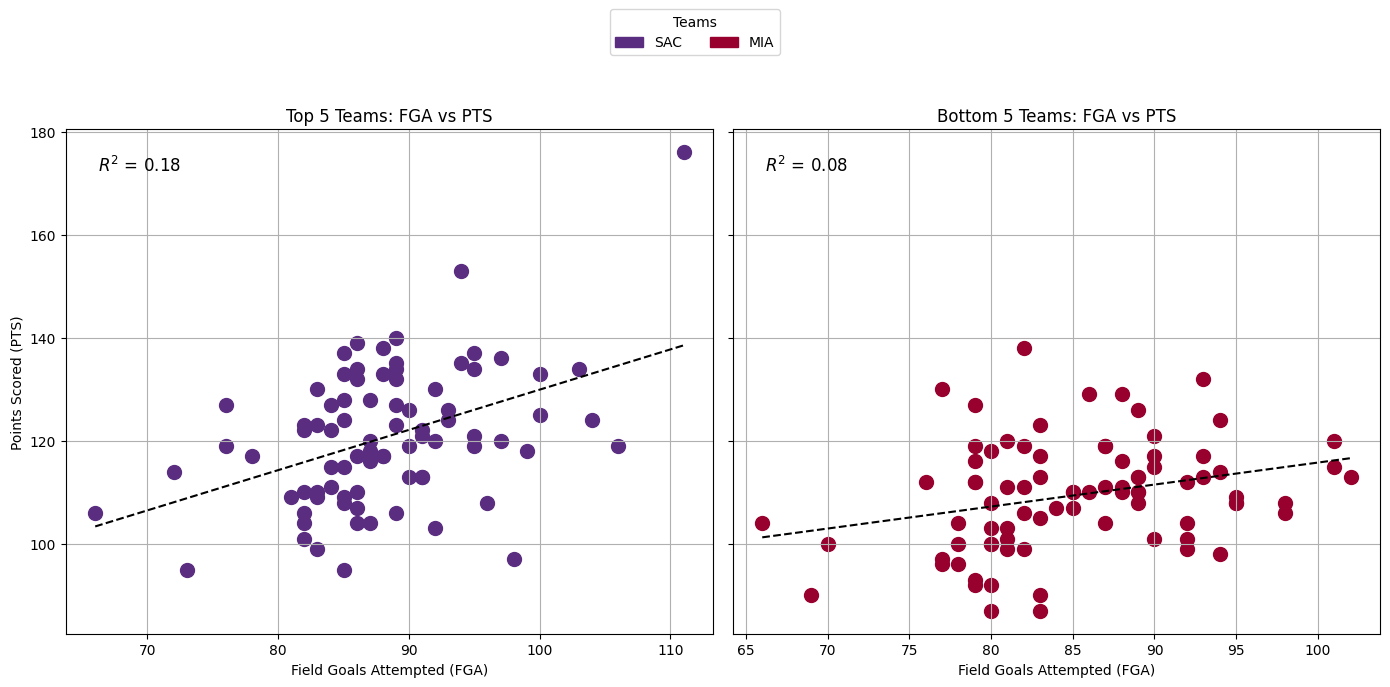
We zoomed in on the highest scoring team (Sacramento) and the lowest (Miami) to test how strong the FGA-to-points relationship was using linear regression.
- Sacramento’s R² = 0.18 — a modest relationship between FGA and points scored.
- Miami’s R² = 0.08 — weaker correlation, suggesting other factors influenced scoring.
🤔 Questions Raised
Does a higher number of field goal attempts directly lead to more wins? Is scoring inefficiency a **team-level issue** or an **individual player issue**? What role do opponents play in limiting team performance?
Day 2
🏀 NBA Playoff Prediction Using Decision Trees
🏆 2022–23 NBA Playoff Status Summary
BKN, BOS, CHI, CLE, DEN, GSW, LAC, LAL, MIA, MIL, MIN, NYK, PHI, PHX, SAC, OKC
ATL, MEM, TOR, CHA, DAL, DET, HOU, IND, ORL, POR, SAS, UTA, WAS, NOP
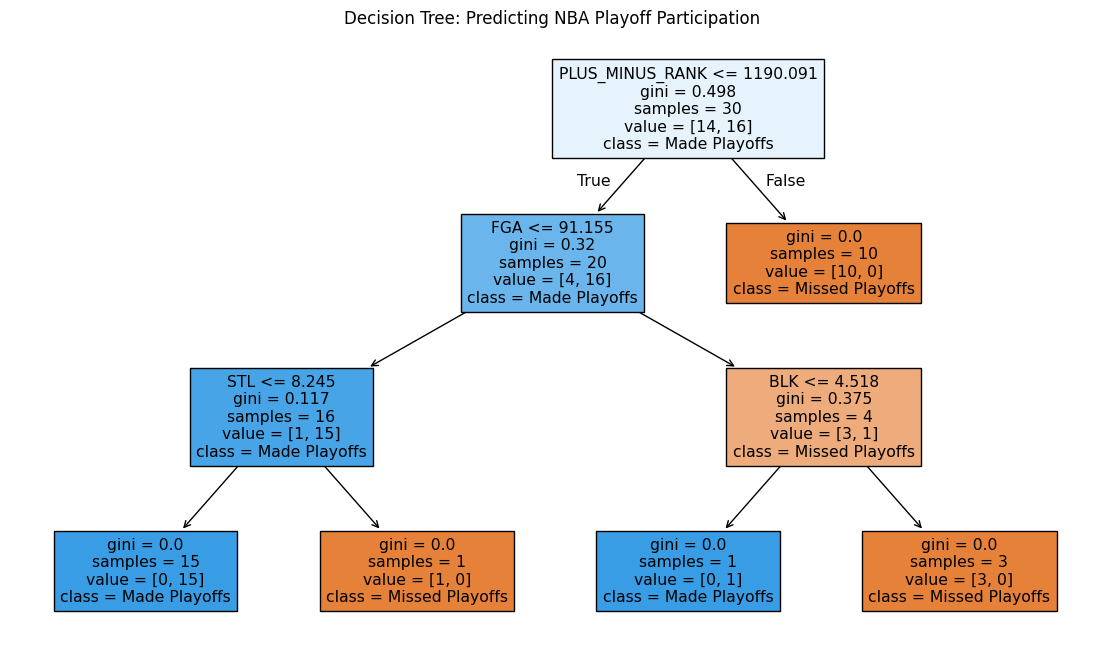
To explore what factors contributed to NBA teams making the playoffs, we built a decision tree classifier using various team statistics such as:
- Plus/Minus
- Points
- Field Goals Attempted (FGA)
- Assists
- Turnovers
- Blocks
Day 3
🧠 Principal Component Analysis (PCA)
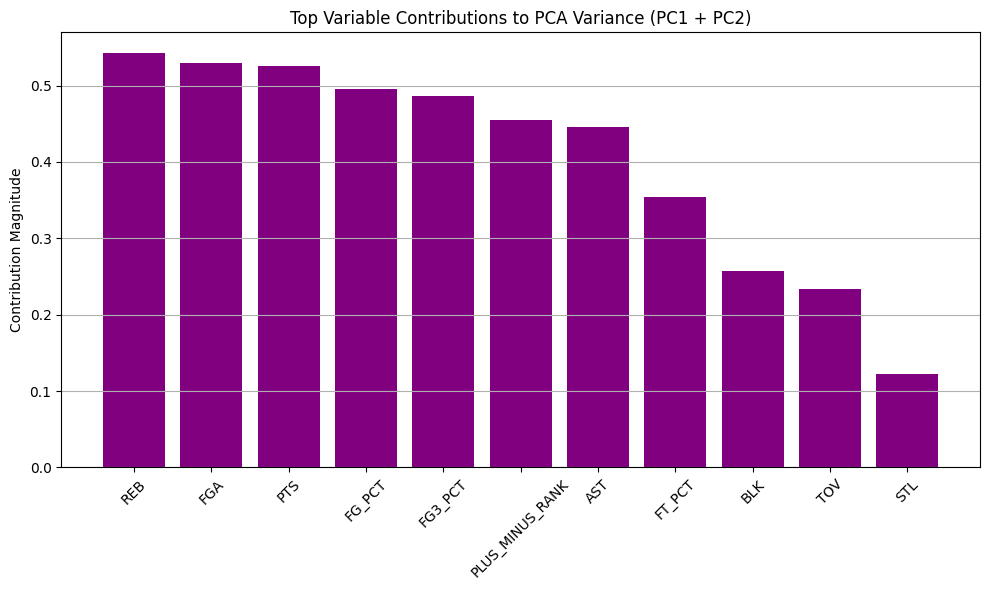
To better understand the variance across NBA team statistics, we used Principal Component Analysis (PCA). Below are visualizations of the PCA results:
- The bar plot shows how much variance each principal component explains.
- The scatter plot shows how teams are distributed in PCA space, highlighting clusters and outliers.
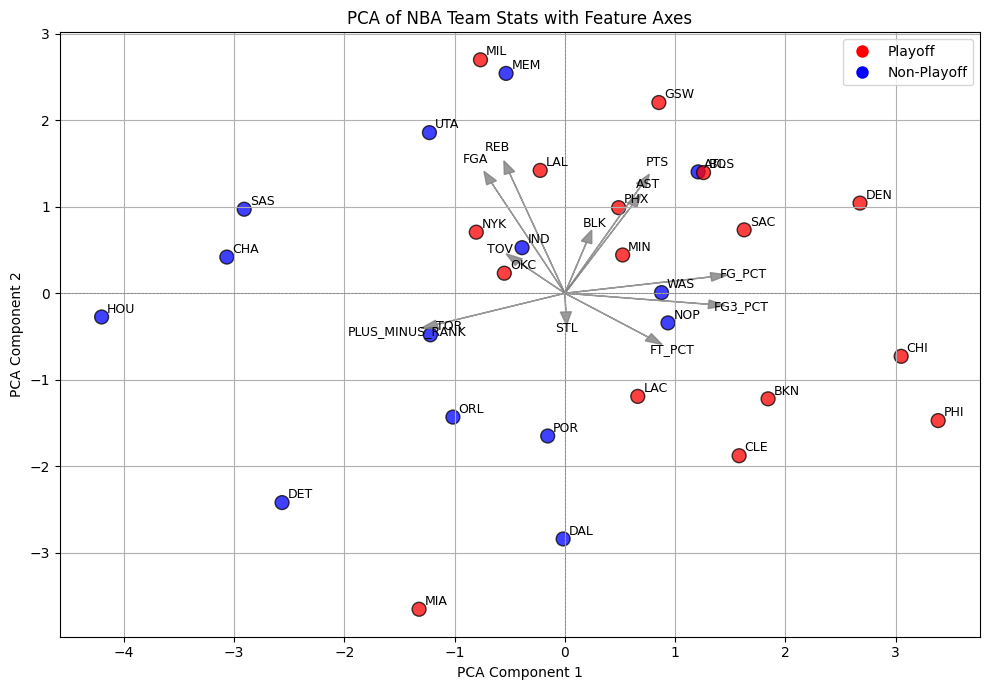
📊 Key Findings
- 🏀 FGA (Field Goals Attempted)
- 🔄 Rebounds
- 🔥 Points
We observed a similar relationship in our PCA results: - 📈 Points correlate closely with Assists - 🎯 Field Goal Percentage aligns with 3PT FG Percentage Most playoff teams clustered strongly around PCA Component 1, suggesting that this component captures the offensive and scoring efficiency that defines postseason success.
🤖 Support Vector Classifier (SVC) Visualization
We applied a Support Vector Classifier (SVC) model to evaluate whether team performance metrics could be used to predict playoff qualification. The SVC model works by identifying an optimal boundary that separates teams based on statistical differences.
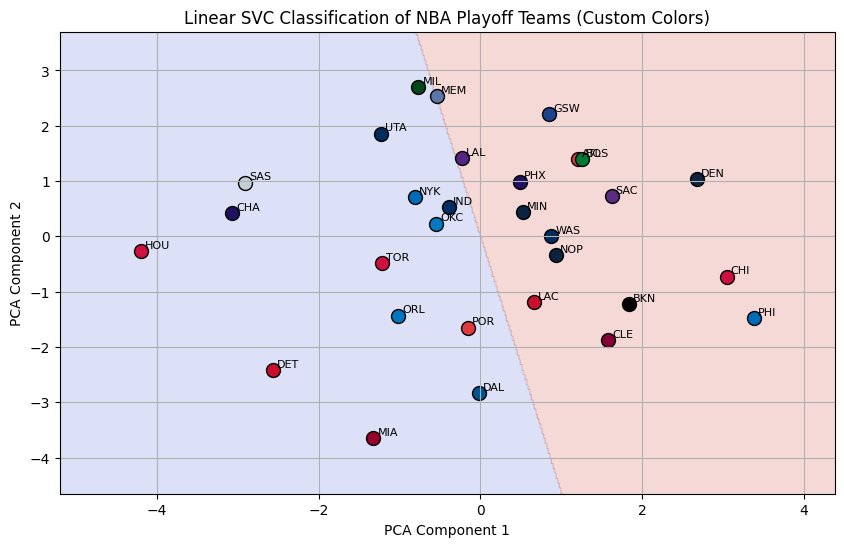
🔍 The visualization above illustrates how well the classifier separated the two groups — reinforcing trends we saw in both the decision tree and raw PCA results.